

Summary of 2024 Reserves
Reserves as of December 31, 2024
| Company Share Reserves | ||||||
|---|---|---|---|---|---|---|
| Description | Light & Medium Oil (Mbbl) |
Tight Crude Oil (Mbbl) |
Conventional Natural Gas (MMcf) |
Shale Gas (MMcf) |
Natural Gas Liquids (Mbbl) |
Total (Mboe) |
| Proved developed producing Proved developed non-producing Proved undeveloped |
191,107 2,377 100,277 |
620 - 9,185 |
339,901 5,092 161,391 |
338,367 44,901 1,012,874 |
62,358 4,427 118,664 |
367,131 15,136 423,836 |
| Total Proved Probable |
293,761 100,605 |
9,805 6,200 |
506,384 197,985 |
1,396,141 916,748 |
185,449 104,520 |
806,103 397,114 |
| Total Proved plus Probable | 394,366 | 16,005 | 704,369 | 2,312,889 | 289,969 | 1,203,216 |
Net Present Values
Summary of Before Tax Net Present Values (Forecast Pricing) As at December 31, 2024
|
|
Before Tax Net Present Value ($MM) (1) Discount Rate | ||||
|---|---|---|---|---|---|
| Description | 0% | 5% | 10% | 15% | 20% |
| Proved developed producing Proved developed non-producing Proved Undeveloped |
7,388 390 7,560 |
6,455 305 4,969 |
5,439 253 3,417 |
4,711 218 2,425 |
4,186 192 1,756 |
| Total proved Probable |
15,337 10,800 |
11,729 6,024 |
9,109 3,967 |
7,354 2,877 |
6,133 2,217 |
| Total proved plus probable | 26,138 | 17,752 | 13,076 | 10,230 | 8,351 |
(1) Includes abandonment and reclamation costs as defined in NI 51-101 for all of our facilities, pipelines and wells including those without reserves assigned.
Profitably Converting PDP Reserves to Cashflow
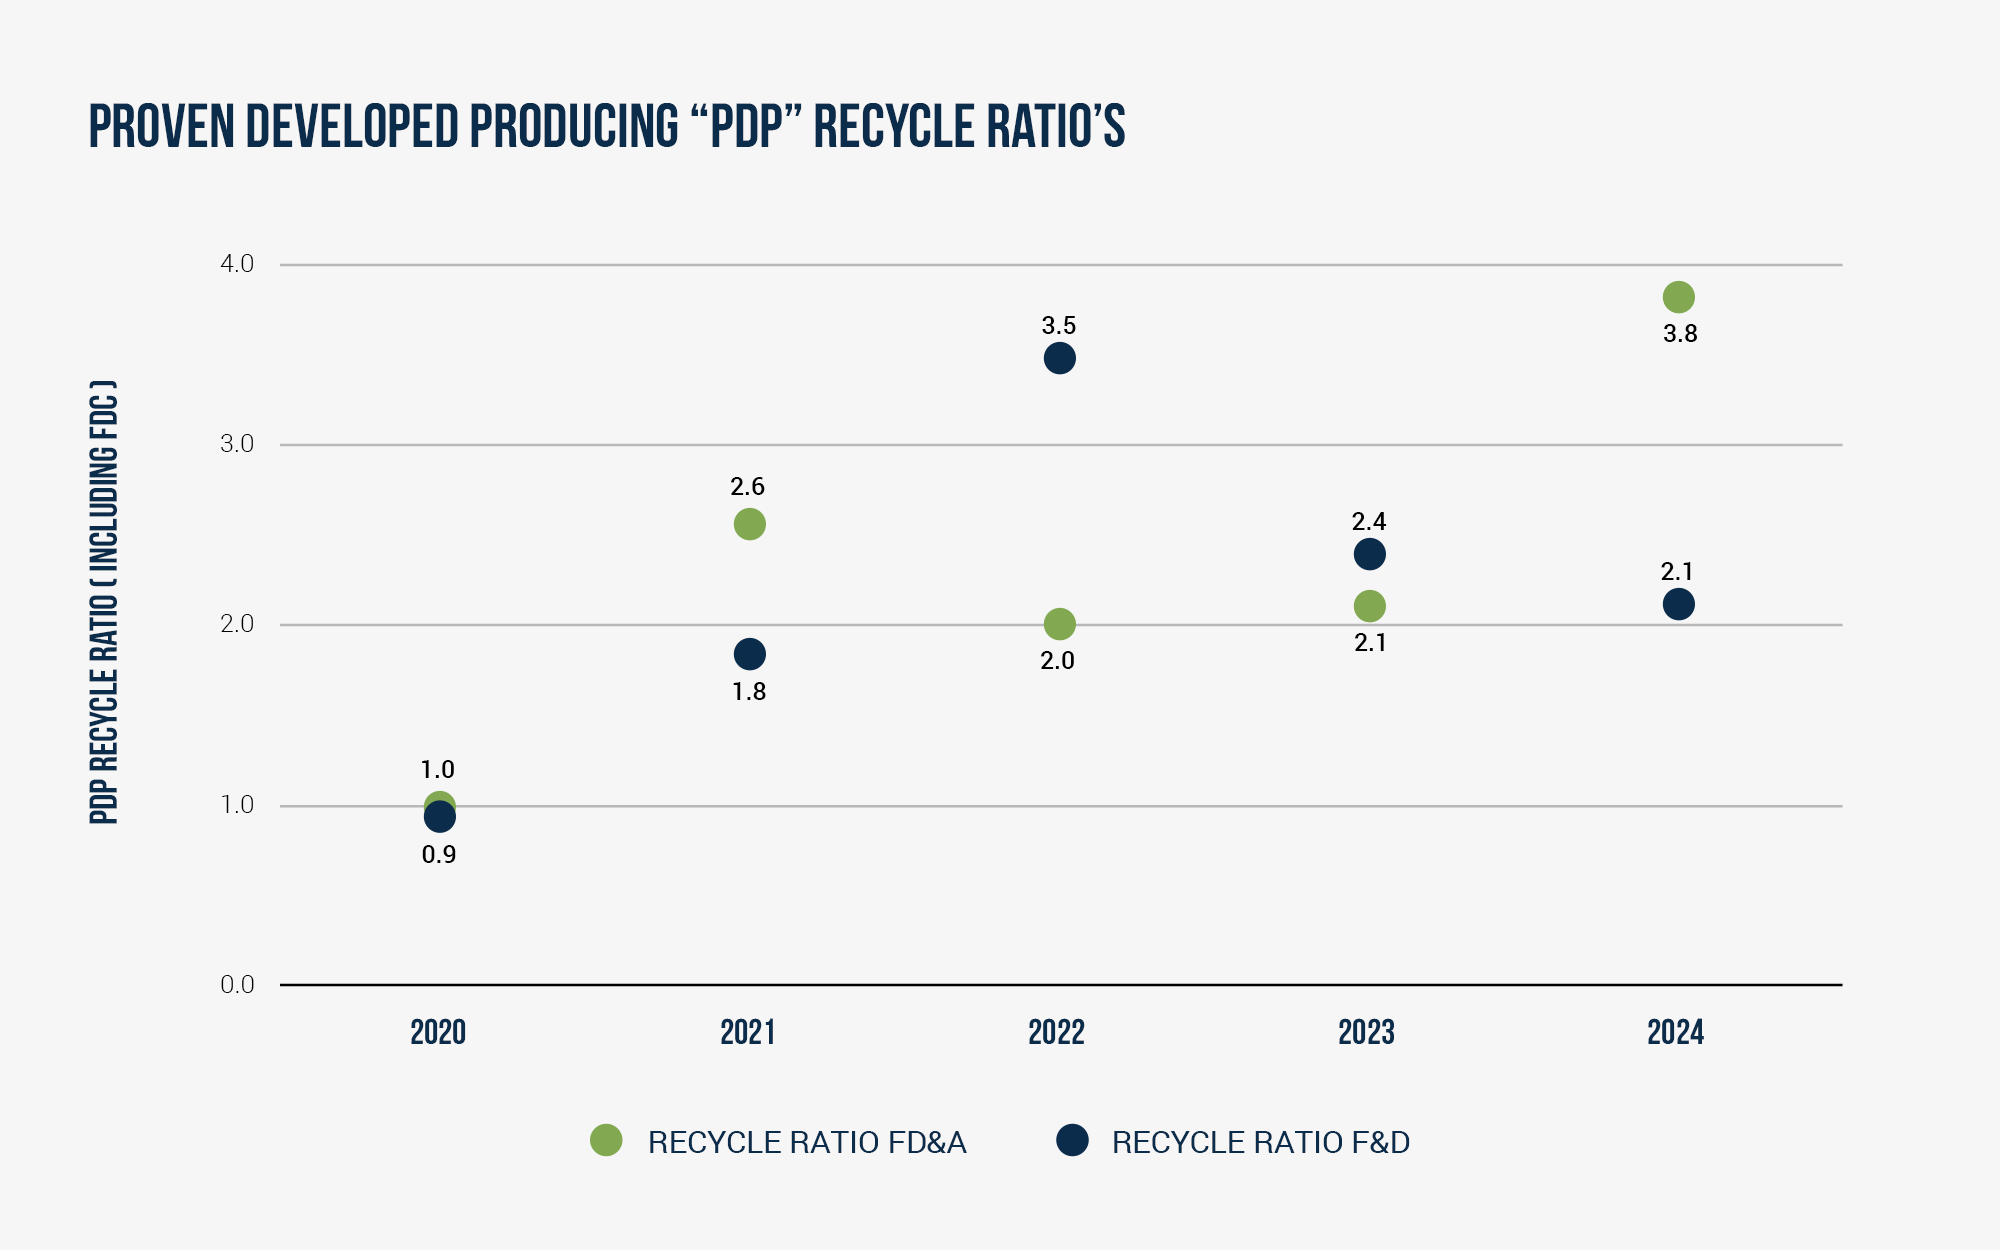
RECYCLE RATIO is a key measure of profitability in the oil and gas industry. The ratio is calculated by dividing the profit per barrel of oil by the cost of finding and developing the barrel of oil. Whitecap focuses on PDP recycle ratio as this reflects whether we are generating sufficient cashflow to replace the barrels we are producing, and therefore can grow economically through internally generated cashflow.
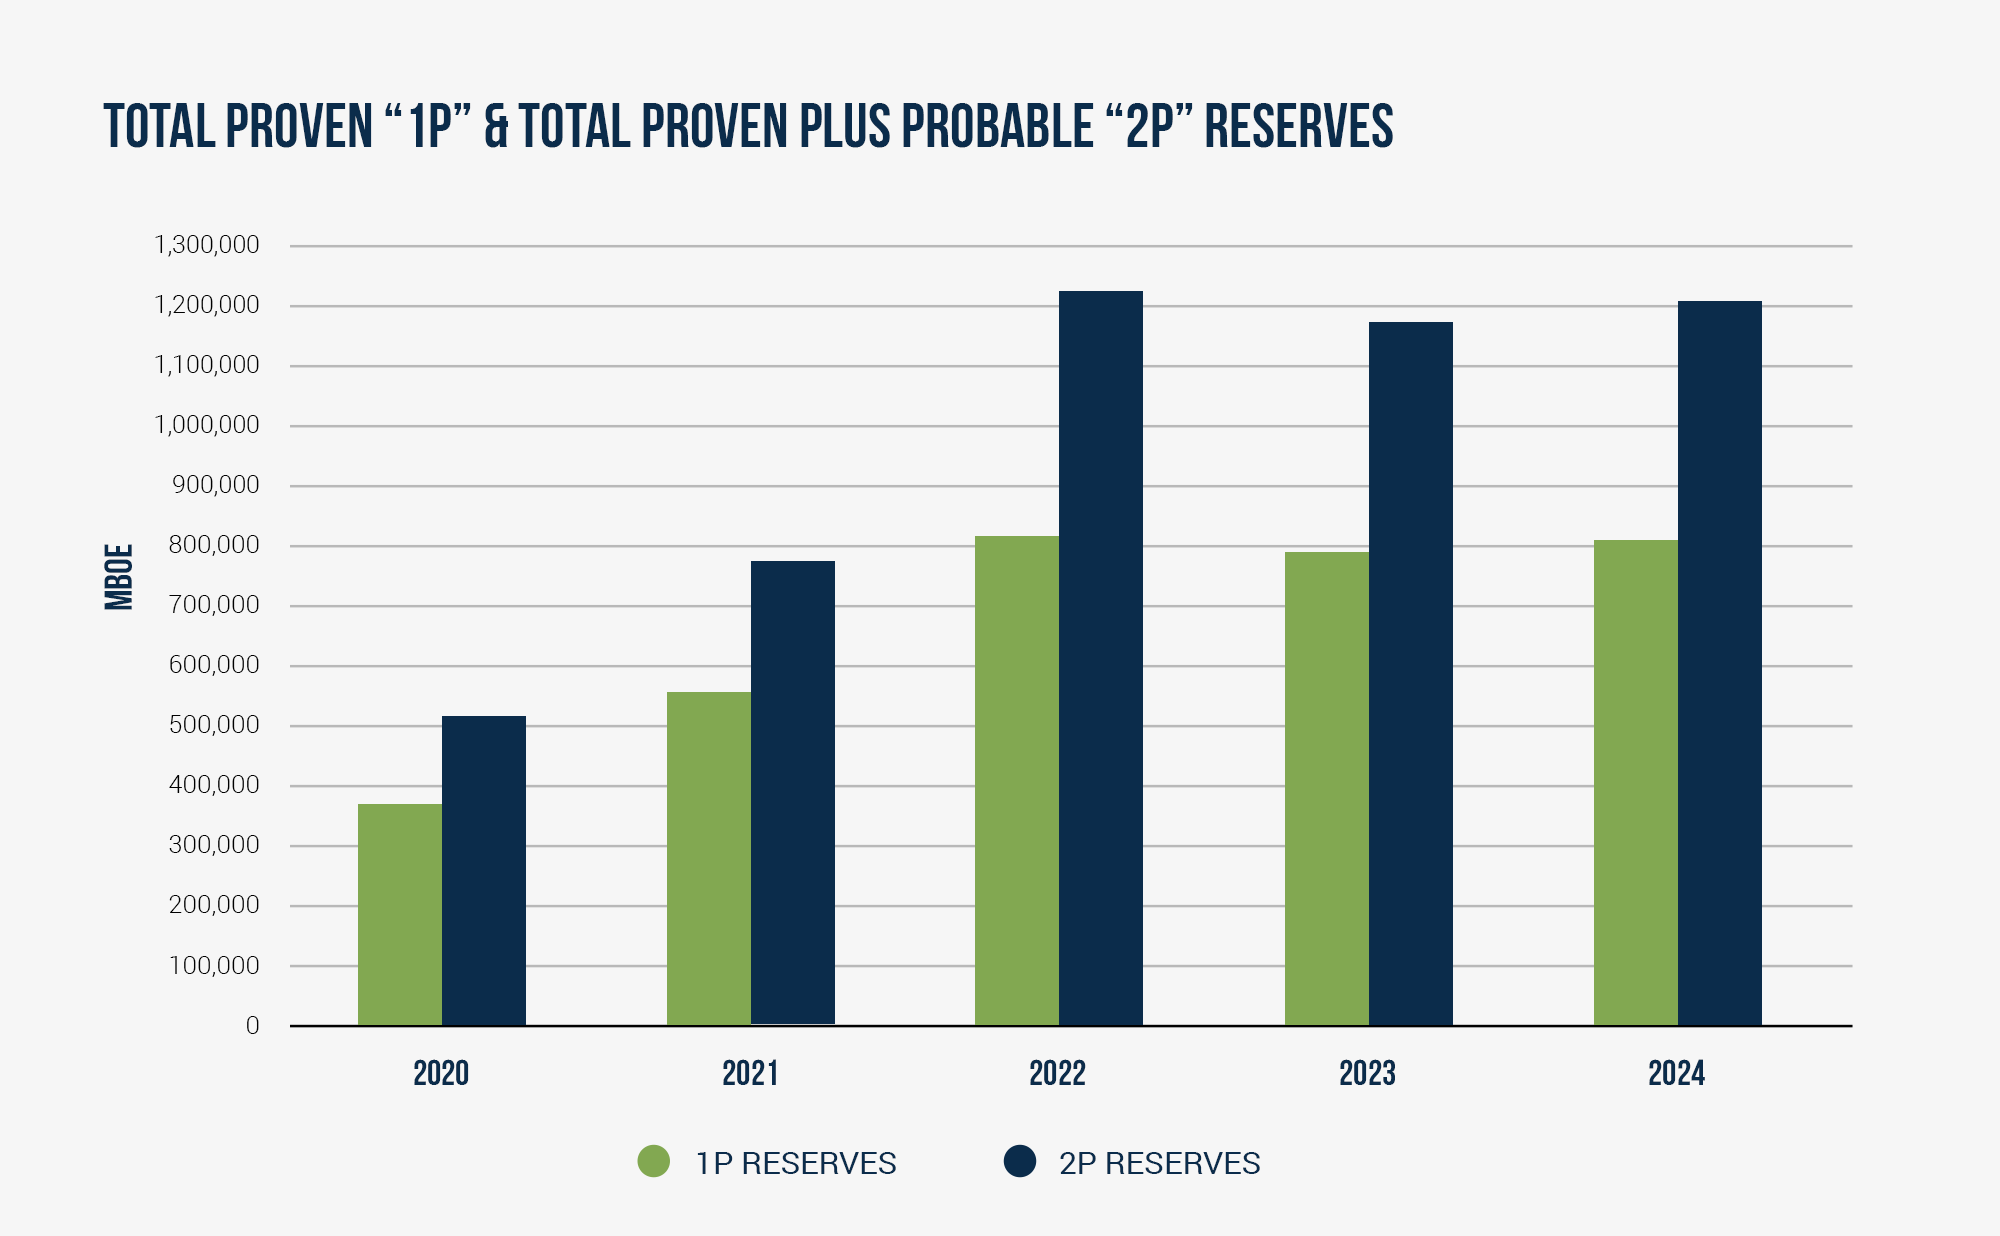
Sustainable Reserves Growth
Click here for full details and disclaimers on our 2024 year end reserves
Headquarters 403-266-0767
- 3800, 525 - 8th Avenue SW
- Eighth Avenue Place, East Tower
- Calgary, Alberta, Canada T2P 1G1
Emergency 1-866-590-5289
- © 2025 Whitecap Resources Inc.
- Privacy / Legal
